Links
Featured Projects
Check out some featured past projects below, with more to come soon:
Interactive time-series data analysis
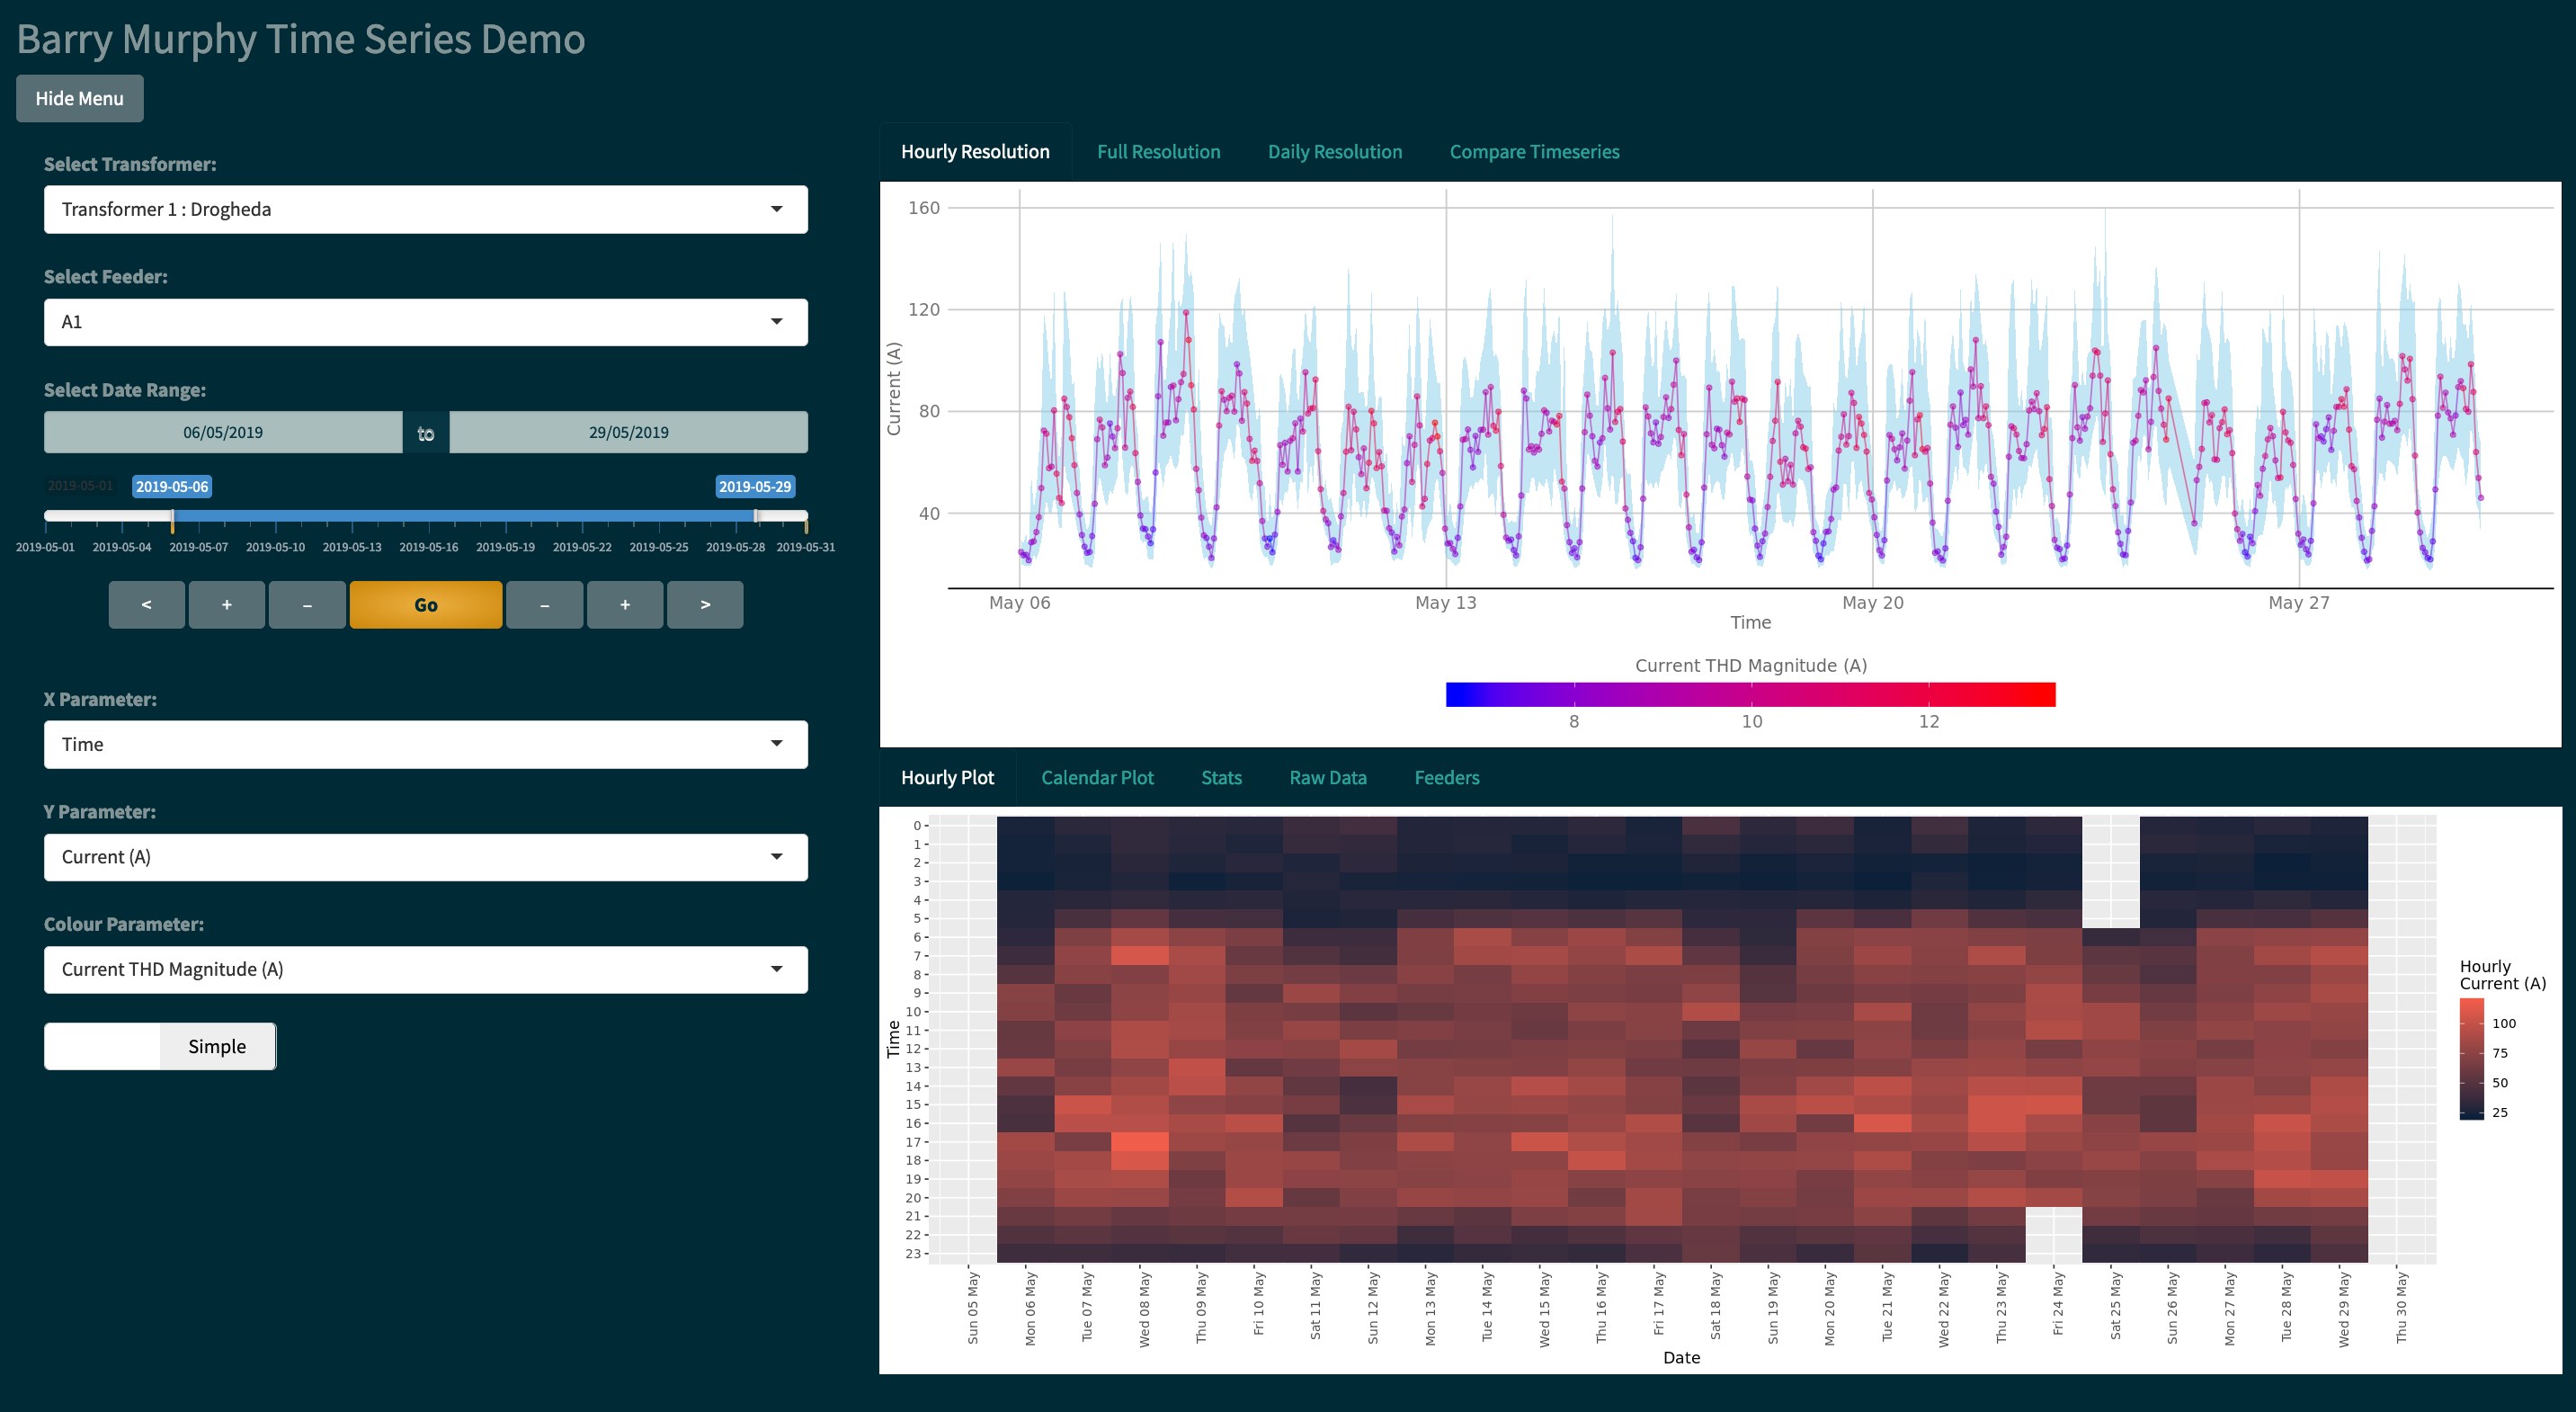
This tool explores time-series data streaming from custom hardware monitoring power distribution transformers out in the field.
I wrote it from scratch in R using Shiny for the web-app elements, and RPostgreSQL to handle database requests.
Details:
- Languages:
- R
- SQL
- HTML
- CSS
- Modules:
- shiny
- dplyr
- ggplot2
- dygraphs
- PostgreSQL
- Info:
- Developed for
Electrical Analytics - Source sealed
- Developed for
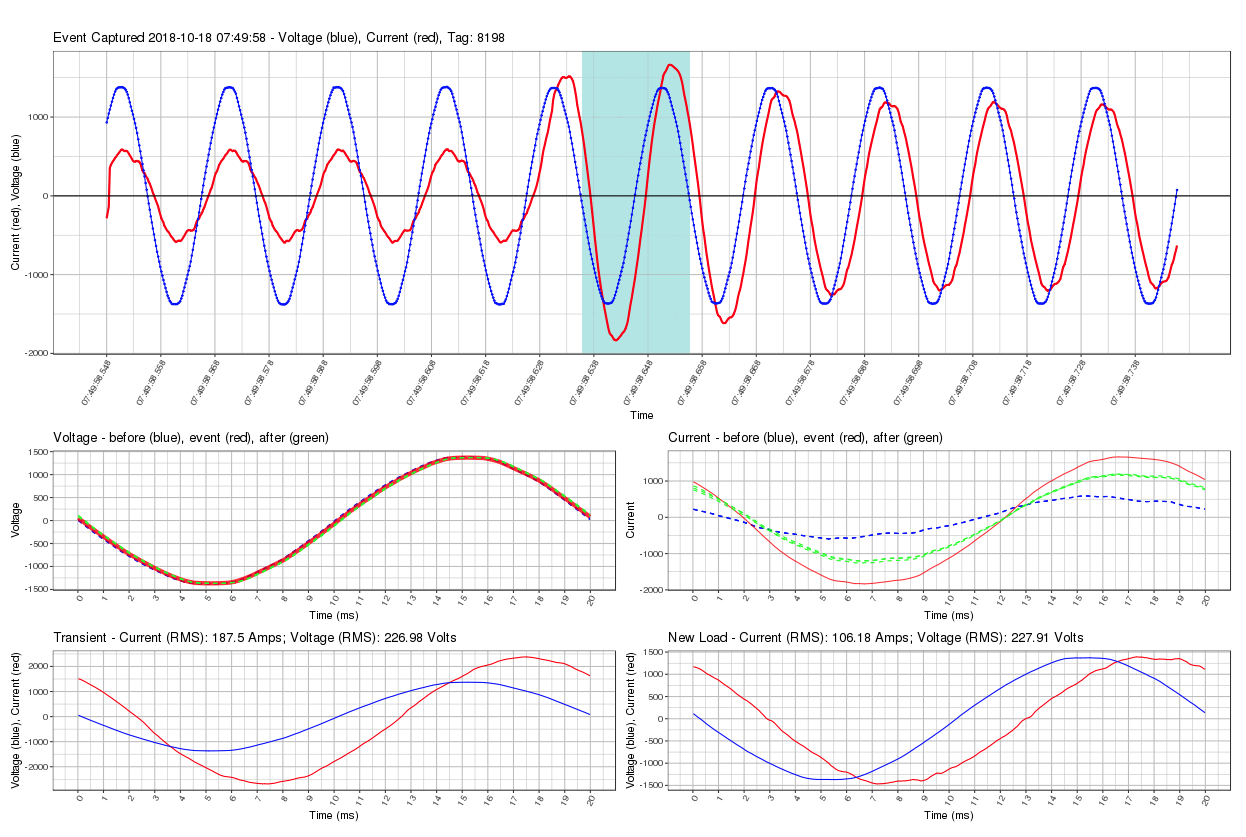
Event detection, clustering, and cost estimation for electrical power grids
Demo coming soon.
This technology (currently under patent application) detects electrical events, categorises them, and gives suggestions on reducing cost/energy usage.
Details:
- Languages:
- R
- Python
- SQL
- Tools:
- dplyr
- k-means
- tensorflow
- ggplot2
- Info:
- Demo Coming Soon
- Developed for
Electrical Analytics - Source sealed under patent application